Mobile applications as we know them are the future or the past? Views differ on the subject. The only thing we are 100% sure is that smartphones and other IT devices are there to stay. Regardless of format, as statistics show, there will always be room for innovation.
If you have an idea that is revolutionary, useful or fun the first thing to do is to learn a little more about the mobile application market. The idea is to do a little market research, to better know the behavior of your future users, but also your future competition.
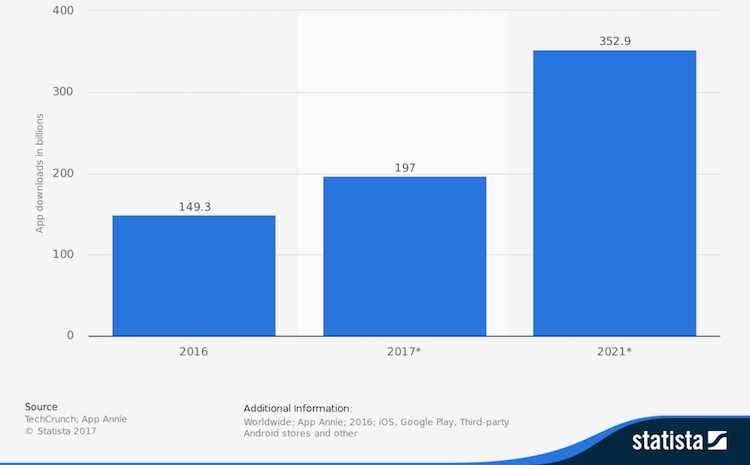
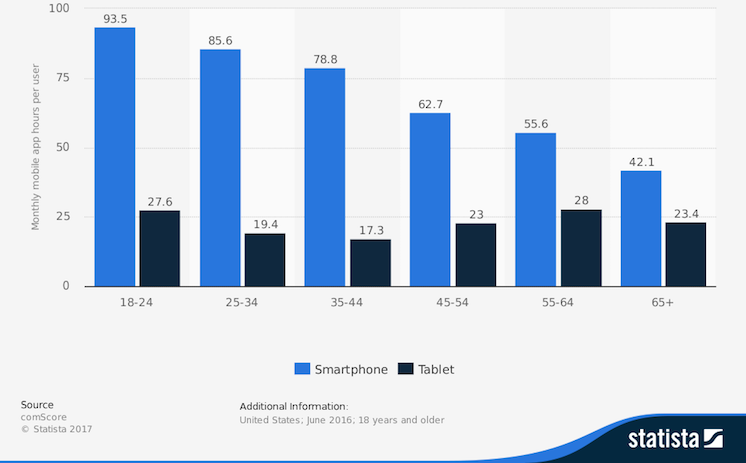
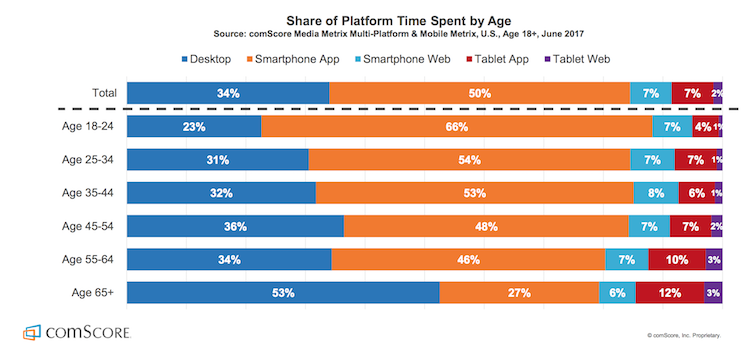
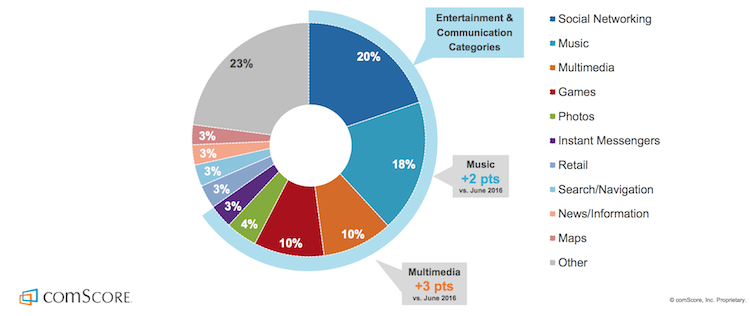
This article will allow you to quickly realize what the mobile application market represents, the competition there is, but also and especially the opportunities you can grab.
The statistics we mention below are from an excellent article that you will find here: http://www.businessofapps.com/data/app-statistics/
If you have an idea that is revolutionary, useful or fun the first thing to do is to learn a little more about the mobile application market. The idea is to do a little market research, to better know the behavior of your future users, but also your future competition.
This article will allow you to quickly realize what the mobile application market represents, the competition there is, but also and especially the opportunities you can grab.
The statistics we mention below are from an excellent article that you will find here: http://www.businessofapps.com/data/app-statistics/